By Christine Manuck
April 2022
Soil has the capacity to absorb a significant quantity of carbon, but it can only serve that purpose if, on the individual farm level, farmers understand and implement the best practices to capture carbon and monitor changes over time. Despite currently being a high emitter of climate change-inducing CO2, agriculture is the one industry that has the capacity to absorb more CO2 than it produces, with the potential to sequester between 25 and 60 tons of carbon per acre. Absorptions on this level would offset over 35% of global anthropogenic greenhouse gas emissions. By focusing on improving soil quality and putting carbon back into the soil, farming for carbon sequestration benefits crops as well as the environment. When soil is exposed to the air, such as through tilling, carbon molecules in the soil are released into the atmosphere. Tillage reduction is a key way to keep carbon in the soil, helping agriculture to transition from a carbon source to a carbon sink.
Interest in tillage reduction practices has been increasing in popularity over the past two decades. No-till production can protect soil, conserving its properties and nutrients, while offering a potential means to save time and money. Through reductions in soil disturbances, no-till farming can benefit soil water retention, nutrient storage, microbial and fungal life, and ecosystem diversity, which all directly impact crop growth. However, conventional no-till farming frequently relies heavily on synthetic herbicides for weed control, presenting a challenge for organic farms and farmers interested in transitioning to reduced or no-till but unwilling or unable to use herbicides as a part of their management. Such farmers are finding ways to transition to no-till production while avoiding herbicide use through methods including permanent bed systems, cover cropping, solarization and occultation, and use of no-till equipment such as the flail mower, chisel plow, tandem disk, and broadfork.
Through a Conservation Innovation Grant (CIG) project funded by the U.S. Department of Agriculture (USDA), NOFA chapters in Massachusetts, New Jersey, and Connecticut have developed a learning community of farmers in the Northeast who have been integrating reduced and no-till methods on their farms. The goal of the project was to increase the practice of organic no-till farming among Northeast farmers by supporting existing low and no-till growers as they innovated and experimented with proven and new methods. To achieve these goals, the three participating NOFA chapters have spent the past three years evaluating changes in soil carbon at 9 partner farms in New Jersey, Connecticut, and Massachusetts. Farmers participated in regular calls to develop a learning community around organic reduced/no-till production and to foster and support innovation between farms and also participated in community-wide educational events and workshops to share techniques. The farms were partnered with their state extension agents to collect data on various indicators to evaluate the role of reduced and no-till in controlling and maintaining crop pests.
Farms participating in the project were, in Massachusetts, Freedom Food Farm, Gaining Ground Farm, and Red Shirt Farm; in Connecticut, Assawaga Farm, Massaro Farm, and Subedge Farm; and in New Jersey, Ironbound Farm, Morganics Family Farm, and Northslope Farm (Figure 1). Farms were selected based upon their tillage practices at project outset and a committed interest in reducing tillage over the duration of the project. In addition to participating in learning group calls, farmers also provided records of crop yield, weed pressure, and pest observations over the project duration. NOFA/Mass staff performed soil carbon proxy tests at each farm annually to evaluate any changes in soil carbon sequestration and soil organic matter.
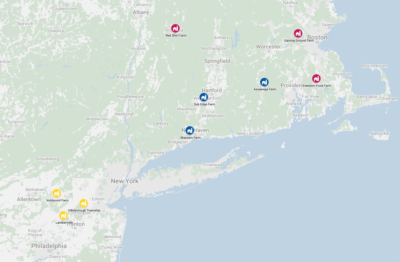
Figure 1. Locations of partner farms throughout the Northeast.
Soil carbon proxy testing offers an indirect, field-based measurement of soil carbon and soil organic matter. As the main component of soil organic matter and responsible for a soil’s water holding capacity, structure, and fertility, soil carbon plays an important role both in agriculture and the environment. Soil carbon proxy testing uses indicators commonly associated with the presence of carbon to indirectly evaluate the amount of carbon in soils. Certain physical, chemical, and biological components of soil, such as soil aggregates and water infiltration rate (physical), active carbon (chemical), and earthworm and root counts (biological), are highly present in soils abundant in carbon and, subsequently, organic matter. By assessing for these components, soil carbon proxy testing offers a way to quantitatively and qualitatively measure a soil’s organic carbon content, and thus soil organic matter content, through a series of field-based metrics. In the context of the CIG project, soil carbon proxy testing was the primary means of assessing changes in soil carbon sequestration in response to changes in tillage management and practice implementation. Soil carbon proxy testing was supplemented with farmer surveying of management practices, crop yields, and pest pressures to understand the tillage farmers were utilizing and their effects on crop production and pests.
Summary of Findings
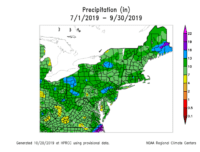 Soil carbon proxy test findings from the three-year study show mixed results. Some soil carbon and soil health improvements were observed in some of the participating farms, particularly those that were performing reduced tillage. It is possible that these improvements specific to the reduced-till farms could have been the result of having a larger space for improvement, versus farms that had been no-till for a period prior to the project and where improvements may be more gradual or subtle. Many of the soil carbon proxy tests are subjective and weather dependent, and 2020 was a fairly dry year followed by an exceptionally wet year in 2021 (Figure 2). In addition, a personnel change prior to the 2021 season may have led to qualitative variations that impacted overall results. New personnel were fully trained on all carbon proxy testing procedures, yet there are still variations in evaluating some of these tests that may alter final results.
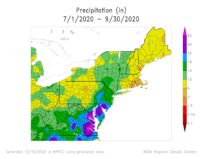
Weather can impact results due to recent rainfall and soil moisture. Testing personnel try to control for weather by only sampling under certain moisture conditions, yet this is not always possible. Unfortunately, many metrics in 2020 showed poorer results than in 2019, the first year of the project, and it was hard to follow trends between the years as a result. Because 2020 was a drier year, it may have exacerbated some of the tests: soil penetrometer readings may have been higher because the soil was drier overall, and tests such as aggregate stability may have been affected as well. There can be some initial challenges when reducing tillage or transitioning to no till; the system doesn’t always show improvements from the outset, yet it is unexpected for soil carbon proxy testing results to get collectively worse for all farms, leading to the suspicion of some other variable, such as weather, having a greater effect. 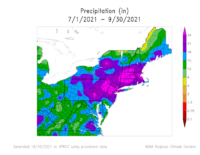
Soil Surface Biology
Soil surface biology assessment utilizes surface observations of a standardized area to identify the ratio between bare soil and covered soil. The amount of soil crusting, living cover, plant species diversity, and non-plant life forms are also quantified. Soil with a lot of coverage promotes better soil health, with percentages of living cover, residue, and mulch suggestive of soil health management practices. Non-plant life forms, including insects, fungi, and animal burrows, are also indicative of soil health.
Soil surface biology observations estimate the percent soil cover, living cover, and plant residue or mulch on the soil surface. For all farms combined, the smallest percent cover was observed in 2020, with the greatest cover observed in 2019. Dividing the farms by tillage, reduced till farms had greater percent cover than no-till farms in every year except 2021, where no-till farms spiked dramatically to 92% cover. It is important to note that the percent cover was lowest in 2020, the same year in which the greatest soil hardness was observed, suggesting a possible relationship between the two. Soil compaction and percent cover may be related in this instance: compaction may have driven reductions in root growth and cover, or reduced soil cover may have caused increased soil hardness through less root penetration or plant material to absorb the impact of rainfall and other potentially compaction-causing stresses.
Soil Aggregation Score
The Soil Carbon Proxy Test assesses subsurface physical and biological components including topsoil depth, root depth, root sheathing, root growth behavior, biopore quantification, soil texture, and aggregate size, type, and prevalence. The soil aggregation score is a reflection of soil aggregation and strength of structure. Stronger aggregation, deeper and more well-branched roots, well-sheathed roots, presence of soil biopores, and deeper topsoil are all indicators of soil health; a higher aggregation score is correlated with stronger, better-structured soil.
For analysis, farms were divided based upon reduced till/no-till. The soil aggregation score was greatest for no-till farms in 2020 and 2021, but in 2021 differences were very small. When all farms were grouped, aggregation scores decreased from 2019 to 2020, and was negligibly higher in 2020 vs 2021 (18.7 versus 18.8).
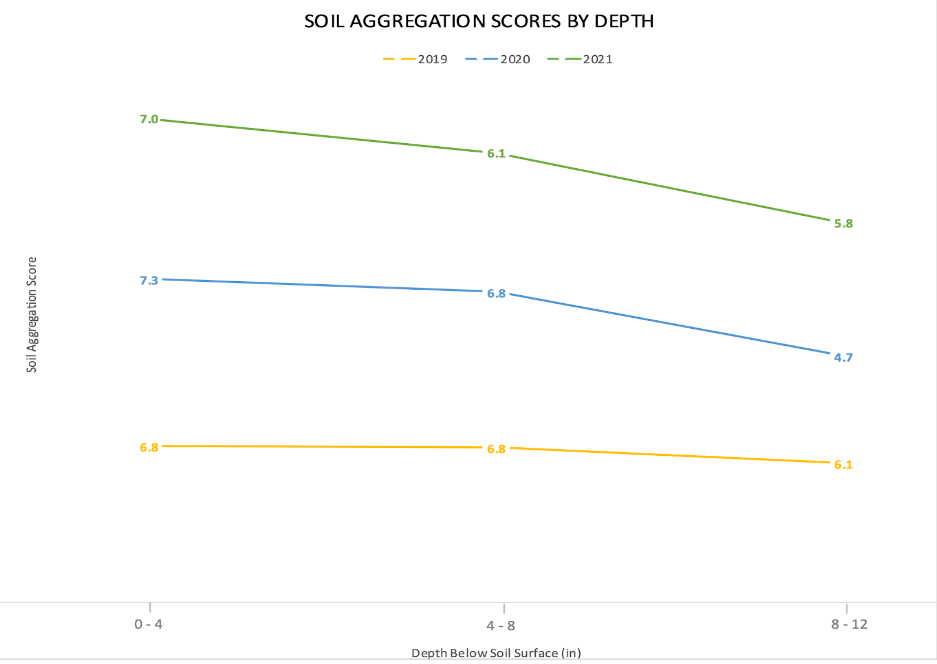
Figure 3. Soil aggregation scores at each depth throughout the duration of the project. Soil aggregation scores evaluated the strength and structure of soil aggregates at various depths below the soil surface as a direct indicator of soil structure and formation in response to changes in tillage.
Higher aggregation scores were positively correlated with lower bulk density at all three depths, meaning that when aggregation scores went up, bulk density went down, presenting two correlated positive indicators of soil health. The relationship was strongest and most pronounced at the 0-4” depth, which had the lowest bulk densities and the highest aggregation scores. The 8-12” depths had the highest bulk densities and lowest aggregation scores (Figure 3), indicating the lowest amount of soil structural formation and strength of aggregates. These findings suggest that soil structural formations occurred first closest to the soil surface, with lesser formations occurring at deeper depths.
Bulk Density
Bulk density testing evaluates the presence of soil pores formed through factors such as soil particle aggregation and/or earthworm activity. Bulk density can vary throughout the soil profile, so samples are typically collected at various soil depths. Soils with lower bulk densities tend to be less compacted and are generally healthier, with greater space for air, water, and plant roots, than those with higher bulk densities.
For analysis, farms were divided based upon reduced till/no-till. Over the project duration bulk density decreased for reduced till farms but increased for no-till farms at the 0-4” and 4-8” depths. In contrast, at the 8-12” depth, bulk density decreased overall from 2019-2021 for both reduced till and no-till farms. When all farms are grouped, bulk density increased at the 0-4” and 4-8” depths and decreased at the 8-12” depth over the project span, following the same pattern as for no-till farms (Figure 4).
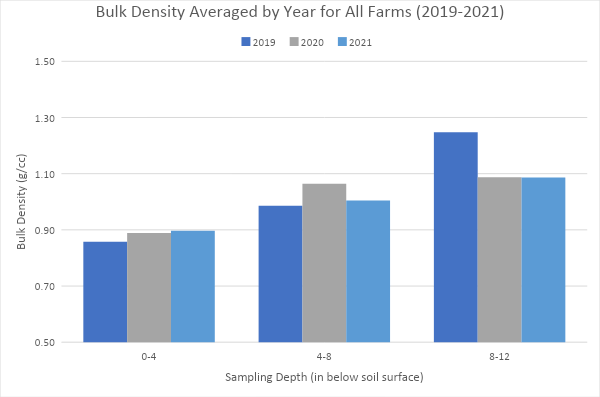
Figure 4. Bulk density (g/cc) for all farms over the project duration. Bulk density provides a measurement of the density of the soil; higher densities indicate more soil within a cubic centimeter with fewer pore spaces and channels for roots and soil biota.
Bulk density values for the 8-12” depth was lower in the reduced till farms than they were for the no-till farms throughout the project duration, suggesting a possible positive tillage effect at these deeper depths. However, it should be noted that the project dataset is very small and the three-year project duration may not be a sufficient amount of time to draw generalized conclusions about the impact of reduced or no-till on bulk density over time. The short project duration and small farm sample size also allows very little leeway for flukes in the data due to extrinsic variables such as weather or soil moisture. A full understanding of the statistical and real-world application of these findings would require a full-scale randomized trial evaluating the effects of varying levels of tillage on these soil health metrics.
Water Infiltration Rate
The water infiltration test indirectly measures soil structure and potential compaction. It measures the capacity of soil to absorb water and not let it puddle on the soil surface or run off and erode sloping ground. Water infiltrates faster into healthy soils with good pores and aggregates to absorb it, and more slowly into soils that are compacted or have a lower carbon content.
Water infiltration rate increased over the course of the project for both reduced till and no-till farms. This finding supports that soil structure may not have dramatically improved, which is also confirmed by a mostly unchanging ag score over the duration of the project. For no-till farms, infiltration rate increased from an average of 22s in 2019 to 60s in 2020 and 85s in 2021. While infiltration rate had a large decrease in 2020 for reduced till farms, possibly due to the drier year, they also didn’t see major improvement over the project duration, as infiltration decreased in 2021 to a level just slightly lower than it started in 2019.
Slake & Turbidity
Slake and turbidity were measured in 2020 and 2021. For all farms, both slake and turbidity were better in 2021 than in 2021, with greater percentages of the sample remaining after 1 minute and with lower turbidity as a result. In 2021, findings from in-field test samples were very close to those of hedge rows. Despite these positive improvements, it’s difficult to draw too large of a conclusion of just 2 years’ worth of data, particularly given that slake and turbidity are measurements of soil structure and aggregation, and other metrics evaluating structure and aggregation represented through the ag score did not show these improvements between 2020 and 2021. Year over year differences may have been due to sampling variability or other extrinsic factors. Further evaluations could help elucidate whether these trends continue over time.
Earthworm Count
The earthworm count quantifies the number of earthworms in 1 cubic foot of soil. Earthworms aid in decomposing soil organic matter into soil carbon, improving plant nutrient availability, developing soil pores, and establishing and maintaining soil structure and aggregates, tightly linking them to soil carbon content and overall soil health. Earthworm count data did not improve over the duration of the project, contrary to expectations. Earthworm counts had a nearly linear decrease at all farms.
Soil Hardness
Soil hardness provides a measure of soil compaction. Soil compaction makes it difficult for plants to send roots down for growth and stability, reduces water infiltration, leading to erosion, and reduces populations of soil microbes essential to maintaining soil structure and health. Compaction is caused by intensive management strategies characterized by tillage and use of heavy equipment that damage soil pores and causes a loss of the aggregates and structure that are essential to soil health. Soil hardness is measured using a penetrometer in both the growing area and hedgerow for comparison; most crops cannot send roots into soils requiring penetration pressure of 300 pounds/square inch (psi) or greater. As with bulk density, lower hardness and penetrometer pressure readings are better than higher ones.
Dividing farms between reduced till and no-till, farms that used no-till throughout the duration of the project had lower average hardness than farms practicing reduced tillage. This was seen at all depths and for all years. Soil hardness was greatest for both groups of farms in 2020, possibly due to lower rainfall levels compared with 2019 and 2021. Soil moisture can affect penetrometer readings as it’s easier to insert a penetrometer probe into moist soil than it is into dry soil. Soil hardness was lowest for both groups of farms in both 2019 and 2021. On the no-till farms there was little difference in soil hardness between 2019 and 2021. Soil hardness was very slightly lower at most depths in 2021, yet differences were negligible. Comparatively, soil hardness was lowest at the majority of the depths in 2021 than in 2019, indicating a potential positive effect of the reduced tillage, particularly at depths beyond 9” (Figure 5).
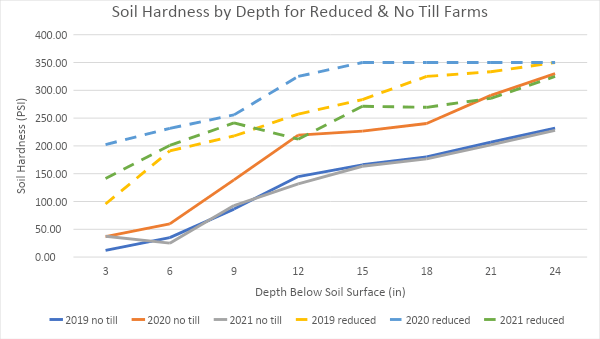
Figure 5. Soil hardness (PSI) at various depths below the soil surface for reduced till and no-till farms during 2019, 2020, and 2021. Lower soil hardness correlates to lower levels of compaction, which is a positive indicator of soil health.
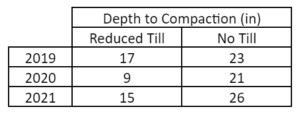
Table 1. Depth to compaction for reduced till and no-till farms. Compaction was always deepest at no-till farms. Both reduced and no-till farms had the shallowest depth to compaction in 2020 compared with 2019 and 2021.
These depth-based findings are somewhat supported by measurements of depth to compaction, which is the depth at which compaction, or soil harness measurements in excess of 350 PSI, was observed. No measurement in excess of 350 PSI is ideal, but, when it does occur, it is preferable to have it as deep as possible to provide the greatest depth of soil for root penetration. Consistent with the positive findings of soil hardness at all depths, depth to compaction was deepest in 2019 and 2021, with the shallowest depth to compaction in 2020 (Table 1).
Based upon these findings, it is likely that the reduced till farms are dealing with increased compaction as a result of the tillage and machinery weight. By comparison, many of the no-till farms use permanent beds and receive very little foot or mechanical pressure, reducing potential compaction-causing events and total overall pressure.
Results by Farm
Only results that showed noticeable improvement or majorly got worse over the duration of the project will be discussed. If a farm or a metric is not discussed, it can be assumed that findings did not change much over the three years.
Assawaga Farm showed good improvements in maintaining soil cover as the project progressed. In 2019, only 30% of the soil was covered; this increased to 95% in 2020 and 100% in 2021. In 2020, 90% of the cover was living, whereas in 2021 only 5% of the cover was living. In both years the remainder was mulch/residue. While slake and turbidity were only performed in 2020 and 2021, Assawaga Farm showed good improvement between the years, with slake jumping from 65% remaining after 1 minute in 2020 to 99% remaining in 2021. Turbidity also increased from 43 in 2020 to 0 in 2021, the best possible finding. The 2021 sample findings are identical as that of the hedgerow. Bulk densities were very low and within ideal growing range for plants at all depths, but did not change much over the duration of the project, possibly because there was not much room for improvement given their starting point.
Freedom Food Farm started the project with good soil cover (95-99%) and maintained it throughout the duration, with a large percentage of it (50-75%) in living cover. The farm also increased the number of plant species in the observation hoop, from 6 species to 7, and had an increase in rooting depth from 12” to 13”. In 2021, most roots were found to terminate at 7”, an improvement from 4” observed in 2020 (root termination depth was not reported in 2019). Root sheathing was not observed in 2019, yet was considered “strong” in 2020 and “moderate” in 2021, suggesting an improvement over the duration of the project. Soil aggregate score, slake, turbidity, bulk density, water infiltration, and earthworm count did not change much over the duration of the project. There was good improvement in soil hardness, with all penetrometer readings generally improving over the duration of the project and with visible improvements between 2019 and 2021 (Figure 6). In addition, the depth to compaction or rocks increased from 24” in 2019 and 2020 to 30” in 2021. These findings support observational findings of increased rooting depth, as soil that has lower penetrometer readings is easier for roots to grow into.
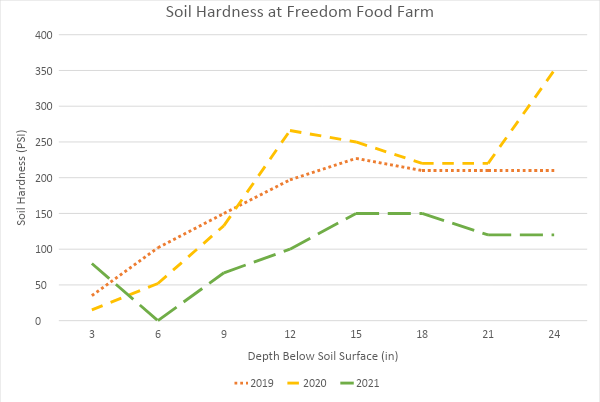
Figure 6. Soil hardness at Freedom Food Farm, based upon penetrometer readings. Lower soil hardness readings are correlated with lower compaction and improved soil health. Soil hardness decreased over the duration of the project, indicating a possible positive effect of the no-till management system.
Gaining Ground Farm increased its percent cover from 50% to 85% over the course of the project, with the majority of the cover living. The depth of the deepest root improved from 4” at the project outset to 14” in 2021, with most roots terminating at 8.5” below the soil surface. Roots also displayed moderate sheathing in 2021, which was not observed in 2019 or 2020. Supporting improvements in soil structure, the soil aggregation score at the 1-4” depth improved over the project duration, driving an overall improvement in the cumulative aggregation score despite little changes at depths below 4”. In addition, while the slake test found the percent of soil sample remaining after 1 minute to worsen from 2020 to 2021, the results from the field sample are identical to those of the hedgerow, suggesting a possible external variable that may have affected its decomposition. Turbidity improved from 60” 2020 to 15” 2021. These findings support the improvement in aggregate score over the project duration, yet it would be useful to have an additional year of observations to evaluate any possible trends. There was little change in bulk density, water infiltration, earthworm count, soil hardness, or depth to compaction or rocks.
Ironbound Farm has only two years of data for this project, making it hard to draw any major trends and findings should be considered multi-year observations, particularly given that 2020 findings from all other farms appeared to generally differ from those observed in 2019 and 2021 due to presumed precipitation effects. Rooting depth showed an improvement between 2020 and 2021, with the deepest root found at 9.5” in 2020 and 12” in 2021. Root sheathing was observed in both years. Topsoil depth and soil aggregation score both improved between years, with topsoil depth increasing from 9” to 12” and aggregation score showing moderate improvements at the 4-8” and 8-12” depths. Slake, turbidity, bulk density, water infiltration, and earthworm counts did not change much between years. There were improvements in soil hardness between 2020 and 2021 at every depth, and the depth to compaction or rocks improved from 9” in 2020 to 15” in 2021.
Massaro Community Farm did not show much improvement in soil cover, particularly in the last year, when there was very little soil cover (5% living cover). There was little change or improvement in rooting depth or root sheathing, yet topsoil depth increased from 12” in 2019 and 2020 to 17” in 2021. Soil aggregation score, slake, turbidity, and bulk density showed little change or improvement over the duration of the project. Water infiltration improved from its baseline measurement of 159s in 2019 to 27.5s in 2020 and 27s in 2021, yet given that there were no observed improvements in soil structure during this time period, it’s possible that the 2019 reading was an outlier. Additional testing, either in another year’s worth of testing and/or in other locations, could help identify the potential source of these findings. Soil hardness improved at nearly every depth over the duration of the project, and depth to compaction improved from 21” in 2019 to 24” 2021.
Morganics Family Farm improved their soil cover from 50% cover in 2019 to 100% in 2020 and 2021, with the majority of that in living cover or mulch/residue. Rooting depth increased from 11” to 12” from 2019 to 2021, yet there was no change in depth where most roots terminate. Moderate root sheathing was observed by the end of the project, and improvement from none observed in 2019. Soil aggregation score improved over the project duration, particularly at the shallower depths of 1-4” and 4-8”, driving an improvement in the cumulative aggregation score to 23.5 at the project end, which was the highest of all farms. Further supporting these soil structural developments, bulk density decreased from 2019 to 2021 at the 0-4” and 8-12” depths, and only slightly increased at the 4-8” depth, and earthworm counts increased from 14 at project outset to 18 at project conclusion. Contradicting these positive findings, soil hardness and depth to compaction or rocks deteriorated over the project duration. It is possible that, as a part of their reduced till management, the farmers may have been needing to do additional passes of equipment, such as through mowing, than they were when tilling, thus driving improvements in soil structure while increasing soil hardness.
Northslope Farm started the project with 100% soil cover but due to trialing the use of tarps for weed control, percent cover dropped over the duration of the project. Percent cover decreased from 100% in 2019 to 15% in 2020 and 5% in 2021 as the farmer trialed clear plastic for solarization and black plastic for occultation. Root behavior showed improvements in sheathing, with moderate sheathing observed in 2020 and 2021 versus no sheathing observed in 2019. Soil aggregation score improved over the duration of the project, particularly at the 1-4” depth, and cumulative aggregation score improved from 18.5” 2019 to 23” 2021. Slake test found improvements from 90% remaining in 2020 to 98% remaining in 2021; there were modest improvements in turbidity as well. Bulk density showed improvements over the duration of the project, with bulk densities at the shallower depths well within the ideal for plant growth and production. Soil hardness showed modest improvements or comparable results to 2019 at depths up to 15” below the soil surface, with large deteriorations from 2019 at depths below 18”. However, depth to compaction or rocks stayed the same at 24” from project outset to conclusion.
Farmer Yield Findings
Farmers were requested to self-report on yield of three crops over the course of the project. By the third year of the project, only one farm found an improvement to in crop yield, for spinach, compared with previous years. Of the 5 farms responding to the 2021 survey with yield data on 13 different crops, 9 crops had about the same yield as in previous years and 4 crops had lower yields compared with previous years. These findings are nearly identical to those from year 2 of the project, yet in the first year of the project, 6 crops had higher yields than previous years, with 3 crops in failure/near crop failure, and 4 crops with approximately the same yield as in past years.
These findings indicate that there may have been some initial improvement in crop yield within the first year of the project, yet these improvements didn’t appear to continue over the duration of the project. It is possible that there was an early soil improvement in response to no-till, and the crops may have benefitted from some residual effects of past management practices, particularly if they were highly effective in keeping weeds and pests in check. However, as the project progressed there may have been effects from tillage reduction that didn’t immediately benefit yield.
Pest Observations
Farmers were requested to self-report on pest observations and crop damage resulting from pests, including weeds, disease, and insect pressures. Throughout the 3-year project, there weren’t findings by any of the farms that showed a major improvement or negative impact from no-till on pests; pest interventions and estimated production costs to be roughly the same as prior to starting no-till. Cabbage worms and potato beetles were the two pests identified as potentially decreasing in prevalence over the duration of the 3-year project.
The following is a summary of their observations and practical implications for tillage reduction and management.
Morganics Farm’s biggest pest pressure in their oats production is weeds. By the 3rd year of without tillage “weeds outcompeted the [oats] crop”. While mowing instead of tilling reduced the amount of thistle in their fields, pressure from other weeds that were uncontrolled by mowing intensified. The farmers mowed early in an attempt to help oats get ahead of other weeds but was unsuccessful, leading to a nearly complete crop loss and the farm’s worse production year ever. They ultimately concluded that, while zero tillage has benefitted their soil health, they would still need light, superficial tillage before spring oat crops. In past years they have tilled before planting planted wheat or rye following oats, and not needed additional tillage. As a result, the farmers concluded that “significant tillage reductions can be achieved, but occasional light tillage will remain a necessary part of the system.” Similarly, NorthSlope Farm expressed their commitment to reducing and eliminating tillage whenever possible, but finds tillage to still play an essential role in controlling perennial weeds, such as invasive grasses in fallow fields being brought into production.
After keeping carrots in the same place for 3 consecutive years, Freedom Food Farm found that the no-till management improved their soil’s fertility and the increased organic matter and soil debris helped the soil absorb the heavy rainfall that fell in 2021. While pressures from carrot rust flies stayed approximately the same throughout the project, the farmer still considered the crop performance to be better than in most years.
Assawaga Farm observed some positive improvements related to pest pressure. In years prior to starting the project, Assawaga Farm would have to go through plantings once or twice per season to remove potato beetles from their potatoes, but didn’t need to by the 3rd year of the project, with minimal impact on crop yield or quality and lower production costs as a result. They also found some improvements in cabbage worm resistance as the project progressed. In project year 2, Assawaga Farm very few cabbage worms or aphids on their cabbage, with minimal impact to crop yield and quality. Due to the absence of aphids and cabbage worms, their estimated production costs were low for the crop as they didn’t need to take any interventions.
In contrast to the findings at Assawaga Farm, by the third year of the project Gaining Ground Farm had a greater reduction in marketable crop due to cabbage worms than in the previous year. However, they also treated with remay instead of spraying Dipel for chemical control as they had done in previous years. This caused their overall production costs to be higher, and a greater reduction in yield, but may indicate some potential that in a year with high pest pressure they were able to start making other management changes that could work to improve the crop without the need for organic pesticides.
Conclusions
Overall, project findings show mixed results on the effects of reduced and no-till management on soil health, crop yield, and pest pressures. Both reduced and no-till farming have proven benefits to all of these components, it is very possible that the three-year project duration was insufficient to capture the effect of these management changes over time. Separate research evidence has shown no-till management practices to work better than heavy tillage, yet reduced and minimal tillage also plays an important role as well. There is some evidence that reduced tillage can have some positive benefits on soil health and crop production, and findings from this project support that there were no overtly detrimental observations from reduced tillage over the project duration. Furthermore, minimal tillage systems may present a management “compromise” between heavy tillage and no-till, which may be particularly appealing for farmers who are facing extensive pest or weed pressures, or may not have the equipment, farm staff, or other practical essentials necessary to support a no-till system. The general expectation is that it can take several years for pest pressures to begin to reduce after transitioning to a no-till system, and it is likely that the duration of this project failed to capture these potential improvements.
All NOFA chapters participating in this project led several on-farm events, workshops, and other educational outreach efforts to help promote reduced and no-till farming. Education outreach ranged from practical implementation of no-till farming to soil carbon proxy testing demonstrations to field-based demonstrations of different equipment used by no-till farmers. In-person events were limited due to Covid-19 beginning in 2020, yet NOFA chapters adapted by offering events in online/webinar formats, virtual workshops, and pre-recorded YouTube videos. Based upon attendance and viewership of live and virtual events and recordings, at least 3,000 individuals participated in education events. This has a significant potential level of impact in the Northeastern U.S., where small farms dominate the agricultural landscape and there is a great opportunity for adoption of reduced and no-tillage management practices. Farmers frequently highlight the value of farmer-to-farmer learning experiences, and the educational materials that were produced through this project has already impacted the farming community. Because of Covid-19, the online format of the majority of these materials will make them available indefinitely, allowing their impacts to remain so long as they have an online presence.
This project has great potential to be repeated in a more controlled format to potentially increase causational associations between management and results of soil carbon, pest, and yield. Completing the project of a longer duration, such as 5-7 years, could also capture soil’s progression and changes in response to reductions in tillage, and its downstream effects on pests and yield. In addition, involving a larger cohort of farmer participants would provide greater statistical power to support findings. Finally, finding a more reliable reporting mechanism for farmers could provide more reliable pest data to help draw stronger conclusions about the effects of tillage reductions on pest pressures. Building upon the experiences from this project, potential next steps for this project would be to repeat the project over a longer duration, with more farmers and better coordination surrounding pest and yield reporting.


